

Financed emissions — classified as Scope 3 Category 15 under the GHG Protocol — are the single most material climate exposure on most financial institutions' books, and treating them only as an ESG reporting checkbox is a costly mistake. They function as a portfolio-level proxy for transition and physical risk, feeding directly into credit probability of default (PD), loss given default (LGD), and equity valuation multiples. The scope 3 emissions finance implications are immediate and operational, not theoretical.
Three actions your team should take now:
- Run a scoped pilot using PCAF methodologies for your top five to ten sector exposures by loan or AUM value.
- Convert outputs into risk metrics — emissions intensity (tCO2e/$M invested), weighted-average carbon intensity (WACI), and sector concentration — and feed them into existing credit and portfolio-risk frameworks.
- Set a quarterly KRI for financed-emissions intensity by sector, reviewed alongside credit migration data.
Pro Tip: Start with the highest-emission sectors and largest individual exposures. The signal-to-cost ratio is highest there, and those positions carry the most material transition risk.
Key Takeaways
Financed emissions (Scope 3 Category 15) are the dominant climate risk exposure for financial institutions and must be treated as credit and valuation inputs, not only ESG disclosures.
| Point | Details |
|---|---|
| Measure top exposures first | Start with the highest-emission sectors and largest positions; that's where transition risk is most material. |
| Convert to risk inputs | Translate financed-emissions intensity into PD/LGD sensitivity and sector concentration limits for credit use. |
| Score and improve data quality | Apply the PCAF data-quality score to every position; prioritize primary data for top exposures. |
| Set governance before scaling | Assign clear ownership across credit risk, portfolio management, and sustainability before expanding the program. |
| Disclose method and limits transparently | Publish your standard, asset-class scope, lookback year, and data-quality distribution alongside any reported figures. |
Table of Contents
- What are financed emissions and how do they map to your asset classes?
- Why financed emissions matter for credit, valuation, and portfolio allocation
- How to measure financed emissions: standards, metrics, and allocation decisions
- What data sources and limitations should your team understand?
- How to embed financed emissions into credit, investment, and stewardship workflows
- What the US regulatory and voluntary disclosure landscape requires now
- A 6-step roadmap from pilot to enterprise-scale financed-emissions use
- How finance teams can close the skills gap on financed emissions
- The operational reality most guides don't tell you
- Sources
What are financed emissions and how do they map to your asset classes?
Scope 1 emissions are direct: a company burns fuel, it owns those emissions. Scope 2 covers purchased electricity and heat. Scope 3 captures everything else in the value chain — upstream and downstream — across 15 categories. For financial institutions, Category 15 is the one that matters: it covers the GHG emissions attributable to loans, investments, and underwriting activity. This is what practitioners call financed emissions.
The core principle is "follow the money." If your institution provides capital to a steel manufacturer, a share of that manufacturer's Scope 1 and 2 emissions is attributed to your portfolio based on your proportional financial exposure. PCAF and the GHG Protocol define the allocation approaches — financial-share, loan-based, and proportional — with asset-class-specific rules.
| Asset class | Financed-emissions example |
|---|---|
| Corporate loans | Borrower's Scope 1+2 attributed by outstanding loan / total equity + debt |
| Listed equity | Investee's Scope 1+2 attributed by market-value share of enterprise value |
| Commercial real estate | Building energy consumption converted to tCO2e per floor area |
| Mortgages | Residential energy use estimated from floor area and energy performance labels |
| Project finance | Project-level Scope 1+2 attributed by loan share of total project value |
| Bonds (corporate) | Issuer's Scope 1+2 attributed by bond value / enterprise value |
| Securitizations | Underlying asset pool emissions aggregated and attributed proportionally |
PCAF's v3 standard now covers ten asset classes, including facilitated emissions from underwriting and insurance-associated emissions. The GHG Protocol sets the overarching Scope 3 framework; PCAF provides the financial-sector implementation layer with asset-class granularity. Both standards are the primary methodological references used throughout this guide.
Why financed emissions matter for credit, valuation, and portfolio allocation
The number one reason finance teams should care: financed emissions act as a proxy for transition vulnerability that can shift borrower creditworthiness and collateral values. This is a credit-risk problem dressed in climate language.
The main financial risk channels:
- Transition risk: Carbon pricing, policy tightening, and technology disruption can compress operating margins for high-emission borrowers, increasing PD and reducing collateral values.
- Physical risk: Flooding, heat stress, and extreme weather events damage assets and interrupt operations, affecting LGD for secured lending and equity valuations.
- Liability and regulatory risk: Litigation exposure and evolving disclosure mandates create contingent liabilities that affect credit spreads and funding costs.
- Reputational risk: Concentrated exposure to carbon-intensive sectors can trigger investor pressure, affect capital-raising costs, and damage franchise value.
Two concrete examples show how this plays out. A bank with a large loan book in heavy industry faces a scenario where a $50/tonne carbon price materially compresses borrower EBITDA, pushing interest coverage ratios below covenant thresholds. That's a credit event, not an ESG footnote. On the equity side, a portfolio concentrated in carbon-intensive utilities or oil majors carries stranded-asset risk: if regulatory timelines accelerate, the valuation multiples supporting those positions can reprice sharply and quickly.
According to the PCAF Financed Emissions Standard, financed emissions represent the vast majority of most financial institutions' total reported GHG footprint — routinely over 99% by tonnage. That concentration means your operational emissions are essentially irrelevant to your climate risk profile compared to what sits in the loan book or investment portfolio.
Double-counting is inherent and expected: one institution's financed emissions are another's Scope 1 and 2. This doesn't undermine the analysis. At the portfolio level, financed-emissions intensity still identifies which sectors and borrowers carry the heaviest transition exposure, which is exactly the signal credit and portfolio teams need.
How to measure financed emissions: standards, metrics, and allocation decisions
The GHG Protocol defines the Scope 3 accounting boundary and the general principle for Category 15. PCAF translates that into asset-class-specific allocation formulas, data-quality scoring, and reporting templates. Think of GHG Protocol as the rulebook and PCAF as the playbook for financial institutions.
Common metrics and when to use them:
- Absolute financed emissions (tCO2e): Total attributed emissions across the portfolio. Best for target-setting and year-on-year trend tracking.
- Financed-emissions intensity (tCO2e/$M invested): Normalizes for portfolio size. Best for comparing sectors, benchmarking, and credit-risk analysis.
- Weighted-average carbon intensity (WACI): Revenue-normalized metric (tCO2e/$M revenue). Preferred by TCFD for listed equity and bonds; useful for ESG disclosure frameworks.
- Implied temperature rise / portfolio alignment metrics: Forward-looking; maps the portfolio to a temperature scenario (e.g., 1.5°C, 2°C). Useful for strategic planning and investor communication.
Choosing a metric depends on the decision you're trying to support. For internal credit-risk analysis, emissions intensity by sector gives the clearest signal. For external disclosure under TCFD or ISSB/IFRS S2, WACI is the standard expectation. For target-setting under SBTi's Financial Institutions framework, absolute emissions with a base year are required.
SBTi's research acknowledges persistent data and traceability limits in Scope 3 target-setting and is actively exploring outcome-based metrics to supplement current GHG inventory approaches. That's a signal to build your measurement framework with flexibility — the methodology will evolve.
Pro Tip: Use one consistent method for internal risk analysis (emissions intensity, PCAF-aligned) and a second complementary metric for stakeholder disclosure (WACI for listed assets). Running two metrics in parallel prevents the disclosure tail from wagging the risk-management dog.
UN-endorsed guidance also recommends different reporting approaches depending on instrument type — a proceeds approach for many debt securities, and an achieves-objectives approach for sustainability-linked instruments. These classification choices affect comparability across institutions and should be documented clearly in your methodology statement.
What data sources and limitations should your team understand?
Data quality is the primary operational pitfall in financed-emissions work. Most institutions start with a mix of sources, and understanding the reliability of each is non-negotiable before converting outputs into risk decisions.
Common data sources:
- Client-reported Scope 1 and 2 emissions (highest quality, lowest coverage)
- Public disclosures via CDP, annual reports, and sustainability filings
- Third-party data providers using modelled proxies (broad coverage, variable accuracy)
- Sectoral emission factors and engineering estimates
- Building energy performance certificates and floor-area estimates for mortgages and commercial real estate
- Revenue or asset-based proxies where no other data exists
The ICAEW analysis makes the structural challenge clear: financed emissions are driven by activities firms finance rather than those they control, which creates data timing mismatches, attribution ambiguity, and inherent double-counting that practitioners must disclose and explain. Over-reliance on third-party proxies without client engagement prevents the risk differentiation that makes the analysis useful.
Practical mitigations:
- Prioritize primary data collection for your top 20–30 exposures by sector and loan value. The effort is concentrated and the payoff in risk signal is highest.
- Apply the PCAF Data Quality Score to every position. A score of 1 (verified reported data) versus 5 (sector-average proxy) carries very different analytical weight.
- Run sensitivity analysis on key assumptions: emission factors, attribution share, and lookback year. A simple high/low scenario on emission factors for your top five sector exposures takes a few hours and reveals how sensitive your portfolio-level intensity figure is to data quality.
- Document lookback-year choices consistently. Mixing 2021 and 2023 base-year data across borrowers without flagging it produces misleading trends.
Pro Tip: When a third-party proxy and a client-reported figure diverge significantly, treat the gap as a credit-engagement trigger, not a data-cleaning problem. It often signals that the borrower's actual emissions profile is poorly understood — by them as much as by you.
How to embed financed emissions into credit, investment, and stewardship workflows
Measuring financed emissions without connecting the output to a decision is an expensive data exercise. The risk-translation step — converting emissions intensity into credit-risk language — is where the work becomes operationally valuable.
Governance checklist:
- Board or risk committee oversight of climate-risk appetite, including financed-emissions KRIs
- Clear ownership: credit risk owns PD/LGD integration; portfolio managers own concentration limits; sustainability team owns methodology and disclosure; vendor management owns data-provider contracts
- Documented methodology statement covering standard (PCAF/GHG Protocol), asset-class coverage, data sources, lookback year, and limitations
Stepwise integration:
- Run a pilot on one or two asset classes with the highest emission intensity.
- Validate assumptions with credit teams — do the emissions-intensity rankings align with their qualitative transition-risk assessments?
- Convert emissions intensity into risk inputs: adjust PD/LGD sensitivity for high-intensity borrowers in carbon-price scenarios; flag high-concentration sectors for limit review.
- Update stewardship priorities based on financed-emissions rankings — the highest-intensity holdings get engagement first.
- Embed a quarterly KRI review: financed-emissions intensity by sector, data-quality score distribution, and coverage percentage.
Questions to ask your data vendors: What is the coverage rate by asset class? What emission factors are used, and from which year? How are modelled proxies constructed? What is the update frequency? Can you provide a PCAF-aligned data-quality score per position?
The decision flow is straightforward: if a borrower or holding exceeds your financed-emissions intensity threshold, escalate to the credit committee and choose between engagement (request primary data and a transition plan), repricing (adjust spread for transition risk), or exit. That single decision rule prevents the analysis from sitting in a sustainability report and never reaching a portfolio decision.
For ESG integration in fixed income, the same logic applies to bond holdings — emissions intensity by issuer feeds into spread analysis and engagement priorities.
What the US regulatory and voluntary disclosure landscape requires now
No single federal mandate currently compels US financial institutions to disclose financed emissions, but the practical pressure is real and building from multiple directions.
Key frameworks and initiatives:
- ISSB / IFRS S2: The global baseline for climate disclosure, covering physical and transition risks and requiring Scope 3 disclosure for material exposures. Increasingly referenced by US institutional investors and cross-border regulators.
- TCFD: The foundational framework that ISSB S2 builds on. Still the dominant voluntary standard for US asset managers and banks; WACI is a TCFD-recommended metric for portfolios.
- SEC climate disclosure rules: The SEC finalized climate disclosure rules in 2024, though their scope and implementation timeline have faced legal challenges. Finance teams should monitor current SEC rulemaking status directly, as requirements may shift.
- CDP: The primary channel through which corporate counterparties disclose Scope 1, 2, and 3 data — a critical data source for financed-emissions calculations.
- PCAF: The operational standard for financed-emissions measurement; adoption signals methodological rigor to investors and regulators.
- GFANZ / Net-Zero Banking Alliance: Coalition commitments that require portfolio alignment targets and financed-emissions disclosure for member institutions. Investor coalitions aligned with GFANZ are increasing expectations for financed-emissions reporting across the market.
- SBTi Financial Institutions framework: Provides science-based target-setting methodology for financial institutions, requiring absolute financed-emissions reduction targets for key asset classes.
The practical implication for US institutions: even without a domestic mandate, large asset managers and banks face investor questionnaires, cross-border regulatory requirements (EU SFDR for funds distributed in Europe), and coalition commitments that effectively require financed-emissions disclosure. Voluntary adoption now avoids compressed implementation windows later.
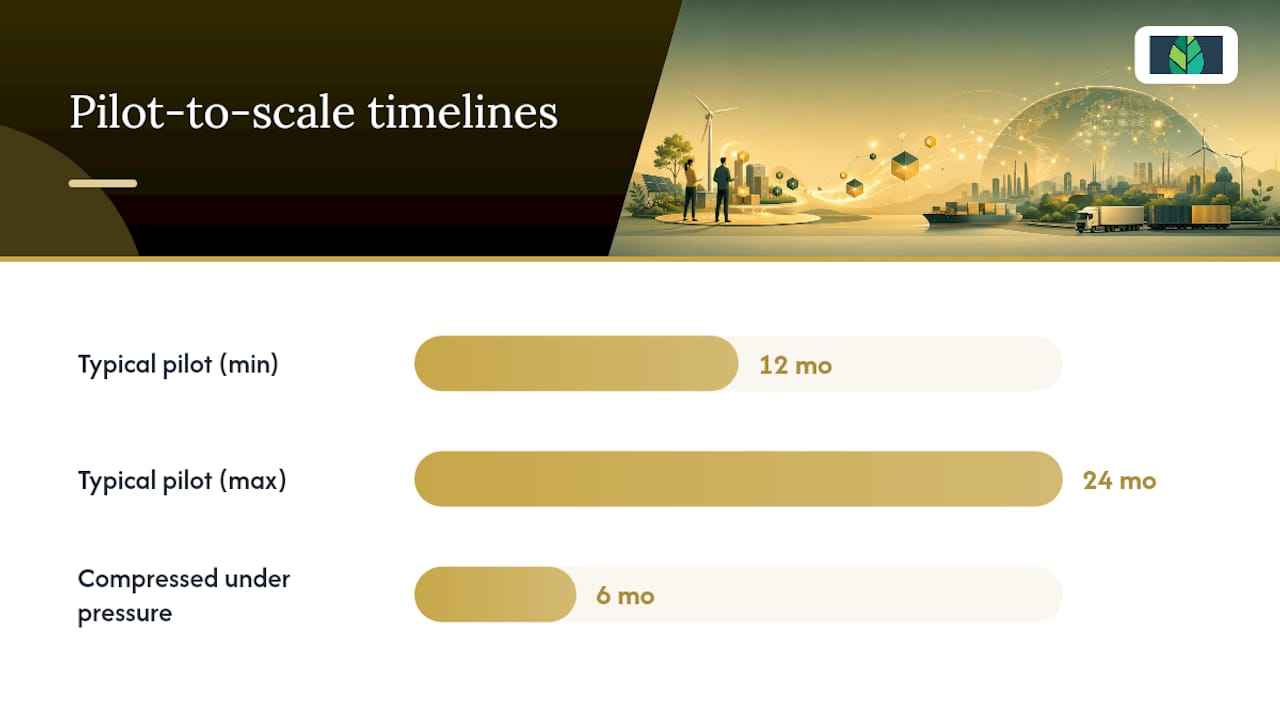
A typical pilot-to-scale cadence runs 12–24 months. Institutions that start with a single-asset-class pilot this quarter can reach enterprise-scale disclosure capability before the next major regulatory cycle. Those that wait face the same timeline compressed into six months under external pressure — a significantly worse outcome for data quality and governance. Validate current SEC and ISSB updates directly at the time of implementation, as rulemaking timelines continue to evolve.
A 6-step roadmap from pilot to enterprise-scale financed-emissions use
Step 1: Set governance and target use-cases (Month 1–2) Define who owns financed-emissions work (credit risk, sustainability, or a joint function), what decisions the data will inform (disclosure, target-setting, credit pricing, or all three), and what the board-level risk appetite statement says about climate exposure.
Step 2: Scope high-priority asset classes (Month 1–2) Identify the two or three asset classes that represent the largest share of your portfolio by value and the highest estimated emission intensity. Corporate loans and listed equity are the typical starting points. Use PCAF's asset-class guidance to confirm which allocation method applies.
Step 3: Run a PCAF-method pilot (Month 2–4) Calculate financed emissions for the scoped asset classes using PCAF-aligned methods. Assign a data-quality score to every position. Document assumptions, lookback year, and data sources. This is the baseline.
Step 4: Convert outputs into risk KPIs and scenario tests (Month 3–5) Translate emissions intensity into credit-risk language. Run a simple carbon-price scenario ($50/tonne and $100/tonne) against your top-10 high-intensity borrowers and estimate EBITDA impact and interest-coverage sensitivity. Present results to the credit committee.

Step 5: Scale data collection and vendor management (Month 4–12) Expand primary-data collection to top exposures. Evaluate and onboard a data vendor for modelled proxies where primary data is unavailable. Establish a vendor scorecard covering coverage rate, methodology transparency, update frequency, and PCAF alignment.
Step 6: Disclose and engage stakeholders (Month 6–18) Publish a methodology statement covering standard, asset-class scope, data-quality distribution, and limitations. Report financed-emissions intensity and absolute figures in line with TCFD or ISSB S2 expectations. Use financed-emissions rankings to prioritize stewardship engagement.
Core KPIs to track during rollout:
- Coverage percentage (% of AUM or loan book with financed-emissions data)
- Average PCAF data-quality score across the portfolio
- Financed-emissions intensity by sector (tCO2e/$M)
- Sector concentration by financed-emissions tonnage
Resource note: a pilot covering two asset classes typically requires one to two dedicated analysts and a data-vendor subscription. Enterprise-scale implementation across six or more asset classes usually requires a cross-functional team and a more substantial vendor relationship, with total costs varying significantly by institution size and existing data infrastructure.
How finance teams can close the skills gap on financed emissions
The technical gap on financed-emissions work is real. Most credit and portfolio teams have strong financial modeling skills but limited exposure to GHG accounting, PCAF methodology, and climate-scenario construction. Closing that gap quickly requires a structured learning path, not just a one-day workshop.
A practical learning sequence:
- Foundation: Climate science basics, the GHG Protocol Scope 1/2/3 framework, and the role of Category 15 for financial institutions.
- Methods: PCAF allocation approaches by asset class, data-quality scoring, and metric selection (absolute vs. intensity vs. WACI).
- Application: Translating financed-emissions outputs into credit-risk inputs, scenario analysis, and stewardship priorities.
A two-month internal pilot project works well as a learning-by-doing vehicle: assign a small team to calculate financed emissions for one asset class, score data quality, and write a one-page risk-translation memo for the credit committee. That memo — connecting emissions intensity to PD/LGD sensitivity — is the deliverable that builds internal credibility fastest.
Structured CPD-tracked learning accelerates board trust and internal adoption. When a sustainability analyst or credit officer can point to a recognized certification in sustainable finance, the methodology discussion shifts from "should we trust this?" to "how do we use it?" Verdantinstitute's course library covers foundational climate science through advanced financed-emissions methods and portfolio decarbonization, with CPD tracking and completion certificates that satisfy professional development requirements. For teams building ESG research skills, the platform's structured tracks are designed specifically for finance practitioners.
Quick skill wins for staff:
- Build an emissions-intensity dashboard by sector using existing portfolio data and PCAF sector-average proxies.
- Score your top 20 positions using the PCAF data-quality scale and identify which ones need primary-data engagement.
- Draft a one-page risk-translation memo linking financed-emissions intensity to credit-spread sensitivity for one sector.
Pro Tip: The credit committee memo is the most valuable output a new financed-emissions analyst can produce. It forces the translation from tCO2e into dollars and basis points — the language that actually changes portfolio decisions.
The operational reality most guides don't tell you
The most common failure mode in financed-emissions programs isn't methodology — it's the gap between the emissions spreadsheet and the credit decision. Teams produce a beautifully formatted financed-emissions report, present it to the sustainability committee, and then watch it sit untouched by the credit officers who actually price loans.
The fix is almost always the same: get a credit officer involved in the pilot from day one. When a credit analyst helps design the emissions-intensity threshold that triggers an escalation, they own the output. When the sustainability team hands them a finished methodology and asks them to use it, they don't.
One practical example: a credit team reviewing a large industrial borrower used financed-emissions intensity data to identify that the borrower's Scope 1 emissions were significantly higher than the sector average — a gap that modelled proxies had masked. That finding prompted a direct engagement request for primary emissions data and a transition plan. The borrower's response, or lack of one, became a factor in the next credit review. The emissions number didn't make the decision; it opened a conversation that the credit team then owned.
The other trap worth naming: overconfidence in modelled proxies. A sector-average emission factor applied to a diversified industrial conglomerate can be off by a factor of two or three. That error compounds when you use the intensity figure to set concentration limits or adjust spreads. The PCAF data-quality score exists precisely to prevent this — a score of 4 or 5 should trigger a note in any risk memo that the figure carries material uncertainty.
Sources
- ENDORSED_Sustainable_Finance.pdf
- Aligning corporate value chains to global climate goals (SBTi Discussion Paper)
- Financed emissions and credit risk (UNC scholarship)
This article is general information, not a substitute for advice from a qualified financial advisor. Consult a qualified financial professional about your own circumstances before acting on anything here.