

ESG data divergence materially distorts investment signals, and every analyst relying on a single aggregate score is working with a measurement problem, not a sustainability verdict. Research decompositions attribute roughly 50–56% of observed divergence between major ESG raters to measurement differences alone, meaning two analysts using MSCI and Sustainalytics on the same company can reach opposite conclusions without either being wrong about the underlying facts. CFA Institute guidance reinforces this: treat ESG scores as inputs to fundamental analysis, not as verdicts. The immediate action is straightforward. Decompose any score you rely on, pull raw indicators, build a materiality map for the sector, and run a sensitivity test before you let a rating drive a position or an exclusion.
Table of Contents
- What drives ESG data and rating divergence
- What the research actually quantifies about divergence
- How divergence changes investment decisions and portfolio construction
- An actionable checklist for diagnosing and managing divergence
- Key Takeaways
- Useful sources for further reading
What drives ESG data and rating divergence
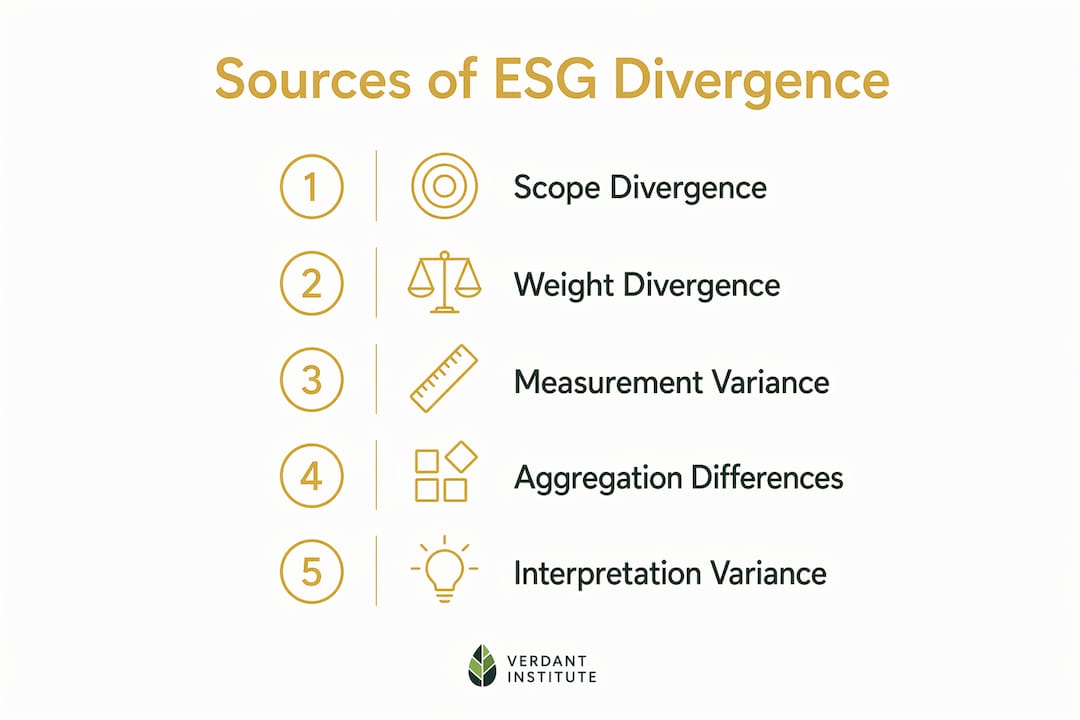
Three distinct mechanisms create the disagreement you see across providers like MSCI, Sustainalytics (Morningstar), Refinitiv/LSEG, S&P Global, ISS ESG, and Bloomberg. Understanding which one is in play changes how you fix it.
Scope divergence is the simplest: providers measure different things. One product covers a company's direct water consumption; another includes supply-chain water risk. Neither is wrong, but they are not measuring the same concept. The OECD documents a striking illustration of this: corporate governance can be assessed using a very small number of metrics in one product and over one hundred in another. That gap alone makes cross-provider comparison nearly meaningless without first normalizing for scope.

Weight divergence occurs when providers agree on what to measure but assign different importance to each component. An indexing-focused product may weight carbon emissions heavily because it anchors to a climate benchmark. A stewardship-oriented product may weight board independence more because it is built for engagement workflows. A research-first product may apply sector-specific materiality weights derived from the SASB framework. Same inputs, different aggregation, different score.

Measurement divergence is the largest driver in practice. When a company does not disclose a metric, raters fill the gap differently: some use industry-average imputation, some apply NLP extraction from sustainability reports, some use alternative data like satellite imagery or regulatory filings. A systematic review confirms that divergence compounds across every processing stage, from indicator selection through data cleaning, missing-value handling, and NLP extraction choices. Voluntary disclosure regimes in the U.S. make this worse. As CFA Institute notes, ESG information remains inconsistently reported, and unverifiable disclosures create coverage gaps that different raters resolve in different ways.
A useful mental model: think of divergence as a pipeline with four stages where noise enters.
- Scope selection (what indicators are included)
- Weighting and aggregation (how indicators combine into pillar and total scores)
- Measurement and proxy choice (how each indicator is operationalized when disclosure is absent)
- Rater effects (analyst judgment calls, update timing, and controversy adjustments)
Each stage is a potential source of disagreement, and each requires a different diagnostic response.
What the research actually quantifies about divergence
The scale of disagreement across major providers is not a minor calibration issue. Cross-provider correlations are low enough that the same company can appear in the top ESG quintile on one system and the bottom half on another. The literature uses the term "aggregate confusion" to describe this, and it fits: the proliferation of ratings can paradoxically raise information asymmetry rather than reduce it when those ratings lack traceable methodology.
"The divergence of ESG ratings creates a 'perverse effect' where multiple, disagreeing ratings add market noise rather than improving information quality for investors." — Aggregate Confusion: The Divergence of ESG Ratings, Open Research Europe
The decomposition evidence is the most operationally useful finding. Measurement differences account for roughly 50–56% of observed variance in leading studies, with scope and weighting splitting the remainder. That means the biggest lever for an analyst is not choosing the "right" provider but understanding how each provider handles missing data and proxy selection for the specific company and sector under review.
Market consequences are measurable. Studies link rating disagreement to lower information quality, which distorts pricing and hampers capital allocation efficiency. Investors trying to identify sustainable outperformers or laggards face a signal-to-noise problem that worsens as more divergent ratings enter the market. Corporate behavior shifts too: empirical analysis links conflicting ESG signals to increased granular disclosure, including changes in Key Audit Matter (KAM) reporting, as firms try to reduce the reputational risk created by contradictory scores. That is a real feedback loop: divergence changes what companies disclose, which in turn changes what raters can measure.
How divergence changes investment decisions and portfolio construction
The practical effects show up differently depending on your role, and they are worth mapping out explicitly.
- Equity analysts using ESG scores as a factor in DCF or comparable analysis face model specification risk. Swapping MSCI for Refinitiv/LSEG on the same universe can change which companies screen as ESG leaders, altering both the peer group and the implied cost-of-capital adjustment. Treating ESG issues as complements to fundamental analysis, rather than as standalone verdicts, is the CFA Institute's explicit guidance for this reason.
- Credit analysts face a related problem in fixed income, where ESG scores feed into credit risk overlays. A governance score built from 4 metrics versus one built from 113 produces very different signals about management quality and audit risk, which matters when you are pricing a bond covenant. The mechanics of ESG in fixed income deserve separate attention for this reason.
- Index product managers carry the most acute exposure. Substituting one provider's scores for another's in an index methodology can shift constituent weights significantly, increasing tracking error and changing factor exposures in ways that are hard to explain to clients. ESG index construction requires explicit normalization for scope before any aggregation step.
- Stewardship teams face a softer but equally real problem: when a company receives conflicting ESG signals from different raters, the corporate incentive to respond to any single engagement is diluted. Mixed signals reduce the leverage that asset owners have in stewardship conversations.
For portfolio construction broadly, divergence creates three specific risks. First, exclusion decisions based on a single provider's score may exclude companies that other credible providers rate positively, concentrating unintended sector or factor bets. Second, ESG factor tilts built on aggregate scores inherit all the measurement noise described above, making the tilt less predictable than it appears. Third, when you run ESG stress tests on a portfolio, the results will differ materially depending on which provider's scores you use as inputs. That sensitivity is itself a risk metric worth reporting.
Pro Tip: Run a quick provider-substitution test on your five largest ESG-driven positions: replace your primary provider's scores with a second provider's scores and check whether your buy/sell/hold conclusions change. If more than two positions flip, you have a measurement-driven divergence problem, not a fundamental one.
An actionable checklist for diagnosing and managing divergence
The following sequence gives you a reproducible workflow. It draws on practitioner guidance from MIT Sloan and the ESG screening methodology literature.
- Identify disagreement instances. Flag any company where two providers you use differ by more than one quintile on the same pillar. That threshold is a practical starting point, not a universal rule.
- Decompose by driver. For each flagged company, determine whether the gap is scope-driven (one provider includes a metric the other omits), weight-driven (same metrics, different aggregation), or measurement-driven (same metric, different proxy or imputation). The OECD's documentation of 4-versus-113 governance metrics is a useful reference for calibrating how large scope gaps can be.
- Collect raw indicators. Pull the underlying indicator data from each provider for the relevant pillar. Normalize for scope before comparing. A company that discloses 80% of the indicators one provider uses but only 40% of what another provider uses will score differently for structural reasons unrelated to actual performance.
- Map materiality. Use a sector-specific materiality framework (SASB standards are the most granular for U.S. companies) to identify which indicators actually matter for the company's business model. Divergence on immaterial indicators is noise; divergence on material ones is a genuine analytical problem.
- Run sensitivity and aggregation tests. Reweight indicators using alternative schemes and check how much the total score moves. Literature confirms that PCA, OLS, and machine learning aggregation methods have all been tried, and no single method dominates. That means your aggregation choice is itself a source of variance worth quantifying.
- Document and monitor vendor changes. Providers update methodologies, sometimes without prominent announcement. A score change that looks like a company improvement may be a rater methodology revision. Build a change log.
For evaluating providers against each other, use this comparison matrix as a starting template:
| Dimension | What to assess |
|---|---|
| Scope / indicators covered | How many indicators per pillar? Which ESG issues are included or excluded? |
| Weighting and aggregation | Equal-weight, sector-adjusted, or proprietary model? Is the method documented? |
| Methodology transparency | Is the full methodology publicly available, or only a summary? |
| Raw-data sources | Company disclosure, third-party data, alternative data, or NLP extraction? |
| Update frequency and coverage | How often are scores refreshed? What is the coverage for small-cap and non-U.S. issuers? |
| Best-fit use case | Indexing, stewardship, credit research, or screening? |
| Access and cost | Licensed API, flat subscription, or per-query pricing? |
For governance specifically, a quick diagnostic that takes under 30 minutes: check how each provider scores board independence, audit committee composition, and executive pay alignment for the same company. These three indicators are widely disclosed, so differences in scores are almost always measurement-driven rather than scope-driven. If scores diverge here, the provider is applying different proxies or weighting schemes, and that tells you something important about how they will handle less-disclosed metrics.
On governance: codify your vendor-selection criteria in a written policy and set escalation triggers for when a provider's methodology change requires a portfolio review. That documentation protects you in client reporting and regulatory inquiries.
Building the skills to work with ESG data at this level
The competence gap for most analysts is not conceptual. It is operational: how to reconstruct a pillar score from raw indicators, how to handle missing values without introducing bias, and how to run a provider-sensitivity test on a real portfolio. A structured learning path covers three layers.
- Foundational theory. Start with materiality frameworks (SASB, GRI, TCFD) and the conceptual distinction between scope, weight, and measurement divergence. Berg et al.'s "Aggregate Confusion" is the essential academic reference for decomposition methodology.
- Data skills. Learn NLP basics for extracting ESG data from sustainability reports, missing-value imputation techniques, and indicator normalization. These are the skills that let you interrogate a provider's score rather than accept it.
- Applied practice. Reconstruct a company's environmental or governance pillar from raw disclosed data and compare it to a commercial provider's score. Run a provider-sensitivity test on a small portfolio. Build a materiality map for one sector from scratch.
Key readings mapped to skills: Berg et al. (Review of Finance) for decomposition methodology; CFA Institute's ESG integration guidance for practitioner frameworks; the MDPI systematic review for a comprehensive taxonomy of divergence drivers; the OECD report for indicator-granularity benchmarks.
ESG research skills at this level, including indicator reconstruction and sensitivity testing, are covered in Verdantinstitute's structured learning tracks. CPD credits are tracked automatically, which matters for professionals maintaining CFA or other credentials.
Key Takeaways
ESG data divergence is an operational risk, not a data-quality complaint: measurement differences alone account for roughly 50–56% of observed rating variance, and analysts who treat aggregate scores as verdicts are systematically mispricing that risk.
| Point | Details |
|---|---|
| Measurement drives most divergence | Roughly 50–56% of rating variance stems from measurement differences, not scope or weighting. |
| Scope gaps are extreme | Governance can be assessed using 4 metrics in one product and 113 in another, making raw comparison meaningless without normalization. |
| Market consequences are real | Rating disagreement lowers information quality, distorts pricing, and changes corporate disclosure behavior. |
| Treat scores as inputs, not verdicts | CFA Institute guidance and MIT Sloan research both recommend multi-source evaluation and materiality mapping over single-score reliance. |
| Verdantinstitute builds operational competence | Structured learning tracks cover indicator reconstruction, sensitivity testing, and materiality mapping with CPD tracking for finance professionals. |
The case for decomposing scores before you act on them
The conventional wisdom in ESG integration is that more data is better. The research says something more uncomfortable: more ratings, without methodological transparency, can make the information environment worse. That is the "aggregate confusion" finding in plain terms, and it has a direct implication for how investment teams should be structured.
Most teams treat ESG ratings as a data feed, the same way they treat price or earnings data. The problem is that price and earnings data have a single source of truth. ESG ratings do not. Two credible providers can score the same company in opposite quintiles, and both can be methodologically defensible. That is not a temporary problem waiting for regulatory standardization to fix it. Even with mandatory disclosure frameworks, measurement choices will persist because companies will always have different disclosure practices and raters will always make different proxy decisions.
The practical implication is that ESG competence needs to sit inside the investment team, not be outsourced to a data vendor. An analyst who can decompose a score, identify whether a disagreement is scope-driven or measurement-driven, and reconstruct a pillar from raw indicators is not just doing better ESG analysis. They are doing better fundamental analysis, because they understand what the data actually represents rather than what the label says.
The teams that will navigate the next phase of ESG integration well are the ones building that internal capability now, before regulatory pressure makes it mandatory and before a high-profile divergence-driven error makes it urgent.
Verdantinstitute: training for analysts who need to work with ESG data, not just read it
Managing ESG data divergence requires more than awareness of the problem. It requires the ability to pull raw indicators, run sensitivity tests, and build materiality maps that hold up under scrutiny from portfolio managers and clients. That is precisely the operational gap Verdantinstitute's curriculum addresses.

The platform's 16 courses and over 160 lessons are organized into tracks that move from materiality frameworks through hands-on data skills to applied portfolio practice. CPD tracking is built in, so professionals maintaining CFA or other credentials can log hours automatically. Plans start at $18/month for students and $58/month for professionals, with no long-term commitment required. For teams managing divergence risk across multiple providers and asset classes, the modular learning tracks let analysts build exactly the skills the checklist above requires. See the full curriculum and current pricing to find the track that fits your workflow.
Useful sources for further reading
The table below maps each primary source to the specific claims it supports in this article.
| Source | Key contribution | Figures cited |
|---|---|---|
| Berg et al., Aggregate Confusion (Open Research Europe) | Decomposition of divergence drivers; "aggregate confusion" framing; perverse information-asymmetry effect | Low cross-provider correlations; capital allocation distortion |
| MIT Sloan summary of Berg et al. | Measurement-share statistic; practitioner recommendations for disaggregating scores | 50–56% measurement share of divergence |
| CFA Institute, ESG Considerations in Investment Analysis | Multi-source evaluation guidance; voluntary disclosure coverage gaps | Qualitative; no specific figures |
| OECD, Behind ESG Ratings (2025) | Indicator-granularity benchmarks; scope divergence documentation | 4 vs. 113 governance metrics |
| MDPI, ESG Rating Divergence: Existence, Driving Factors, and Impact Effects | Systematic taxonomy of divergence drivers across processing stages | Qualitative taxonomy |
| ScienceDirect / Elsevier, Does ESG Rating Divergence Affect KAM Disclosure? | Corporate behavioral response to conflicting ratings; KAM disclosure changes | Qualitative; empirical direction |
- Berg et al. / "Aggregate Confusion" is the foundational academic reference for any analyst building a divergence decomposition framework. The Open Research Europe version is open access.
- MIT Sloan's practitioner summary translates the Berg et al. findings into analyst-ready language and is the fastest entry point for teams without time for the full paper.
- CFA Institute's ESG integration refresher is the most directly applicable practitioner guide for U.S.-based analysts and maps to CFA curriculum standards.
- The OECD report is the best single source for understanding how dramatically indicator scope varies across commercial products.
- The MDPI systematic review provides the most comprehensive taxonomy of divergence drivers and is useful for teams building internal methodology documentation.
- The ScienceDirect paper on KAM disclosures is the most specific empirical source on how divergence changes corporate behavior, relevant for analysts tracking disclosure trends.
For reading on how to read rating components and understand what individual rating elements signal, Oracle Investments' primer offers a concise practical reference.